
Excessive gambling in France, in the regulator's figures
For press and research
France's gambling regulator, the ANJ, has built an algorithm that classifies every account-based player into four risk profiles. Its first result, published in May 2026: 8.7% of players account for 60% of gross gaming revenue. Its second publication, in October 2026, shows where that concentration sits: in the competitions the general public ignores and in bets settled period by period. The two publications had never been assembled; this page assembles them. The limit is stated in this introduction: the measured perimeter is licensed account-based gambling in France (online + FDJ + PMU) — online casino, including crash games, is outside that perimeter, and no figure on this page describes a crash-game player.
- 600,000 players at high probability of excessive gambling in the second half of 2025 — 8.7% of account players — generating €1.2 billion of gross gaming revenue, 60% of the total.
- Operators spotted 89,000 of these players in 2025: about one in seven, on the regulator's model.
- On the Brazil, Saudi Arabia, Japan and Australia championships, more than 80% of stakes come from excessive profiles; on the World Cup, the recreational share reaches about 35%.
- About €900 million of football stakes a year are placed outside European time slots — the night and the morning are covered by championships on other continents.
The full dataset is attached to this page, as a free download.
The key figures
- 600,000 players — the number of players at high probability of excessive gambling identified by the ANJ algorithm in the second half of 2025, i.e. 8.7% of the total account-player population; about 300,000 of them are classified "manifestly excessive".[1]
Source: ANJ, presentation of the excessive-gambling detection algorithm, 13 May 2026 (second-half 2025 data). - 60% of gross gaming revenue — the share generated by these players (€1.2 billion), a proportion rising steadily since 2023.[1]
Source: ANJ, May 2026. - 89,000 against 600,000 — the excessive players spotted by operators in 2025 (31,000 in 2024), against the regulator model's ≈600,000.[1]
Source: ANJ, May 2026. - More than 80% — the share of stakes carried by the excessive and manifestly excessive profiles on the Brazil, Saudi Arabia, Japan and Australia championships (football, first half of 2026).[2]
Source: ANJ, "Paris sportifs en ligne" note, October 2026. - 80 to 89% — the share of stakes on a period of play (half, quarter, set, game) carried by the same profiles, depending on the sport (second quarter of 2026).[2]
Source: ANJ, "Paris sportifs en ligne" note, October 2026.
| Indicator | Value | Perimeter | Source |
|---|---|---|---|
| Players at high probability of excessive gambling | ≈ 600,000 (8.7% of account players) | Licensed account play, H2 2025 | ANJ, May 2026 |
| Of which "manifestly excessive" | ≈ 300,000 | Licensed account play, H2 2025 | ANJ, May 2026 |
| Gross gaming revenue of this group | €1.2bn (60% of the total) | Licensed account play, H2 2025 | ANJ, May 2026 |
| Players spotted by operators | 31,000 (2024) → 89,000 (2025) | Licensed operators | ANJ, May 2026 |
| Online sports-betting market | €11.5bn stakes (+12.0%) · GGR €1,766M (+10.4%) | France, year 2025 | ANJ, Oct. 2026 |
| Football stakes outside European slots | ≈ €900M a year (14.2% of football stakes) | Online sports betting | ANJ, Oct. 2026 |
| Return-to-player rate (sports betting) | 84.67% (annual cap: 85%) | France, year 2025 | ANJ, Oct. 2026 |
Reading note: the first three indicators describe licensed account-based gambling in France (online + FDJ + PMU). They describe neither online casino, nor crash games, nor any market outside France. The full table, with shares by profile and by bet type, is downloadable as CSV below.
600,000 players, 8.7% of accounts, 60% of gross gaming revenue
The central fact of the May 2026 publication is not the number of players but their weight. In the second half of 2025, the ANJ algorithm identified about 600,000 players with a high probability of excessive gambling — 8.7% of the total account-player population, on the perimeter of licensed account-based gambling in France (online + FDJ + PMU).[1] These players generated €1.2 billion of gross gaming revenue, 60% of the total product of the same perimeter. In other words: fewer than one player in eleven carries three-fifths of the measured market's revenue.
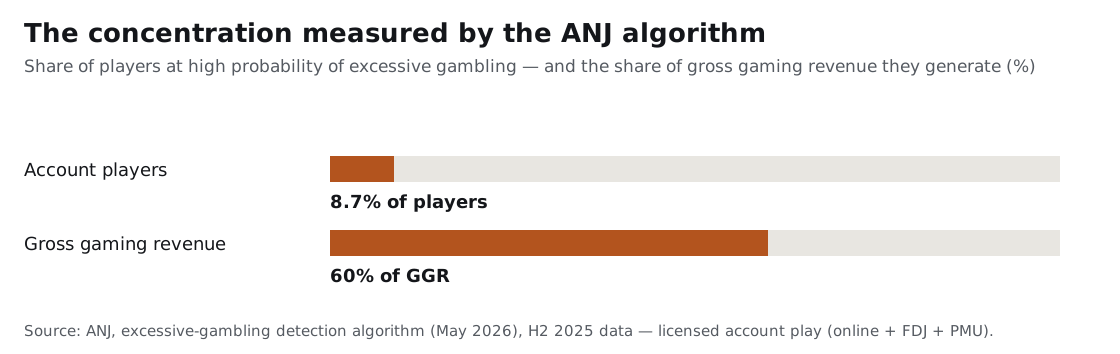
Two precisions from the ANJ frame this 60%. The first is a trend: the proportion has risen steadily since 2023, and the number of excessive players is growing faster than the total number of players — market growth alone does not explain it. The second is a definition: the 60% is computed on excessive players' losses over all players' losses for the semester, with the rare players showing a positive balance over the period excluded from the calculation.[1] Within the group, about 300,000 players are classified "manifestly excessive" — those whose identification by operators the ANJ considers imperative.
Our conclusion no. 1: concentration, not participation, is the central fact of the measured market. Public debate counts players; the regulator's data describe a revenue that depends on a minority — and that dependence is rising while the market grows.
How the algorithm classifies players (23 indicators, 4 profiles)
The algorithm, developed in-house by the ANJ from 2024, uses 23 indicators or risk criteria to produce a single score per player. The indicators fall into four families: financial movements, game moderators (including the use of self-exclusion tools, which the ANJ presents as a strong signal of difficulty encountered), gambling activity and frequency, and the player's history.[1] The data are those operators transmit continuously to the regulator for all player accounts — licensed online operators, FDJ and PMU.
Based on the score, each player is placed in one of four profiles: recreational player, moderate-risk player, excessive player, manifestly excessive player — the green, yellow, red and black of the October note.[2] The algorithm's performance was validated and measured against the Canadian Problem Gambling Index (ICJE), under the oversight of a scientific committee. The ANJ notes that similar initiatives are under way in Spain and the Netherlands, and that its own is the first algorithm of its kind available in Europe.
The regulator also sets its own tool's limit: the algorithm is not intended to measure the exact number of excessive gamblers, nor to estimate the prevalence of excessive gambling as general-population surveys do.[1] It is a steering instrument — a reference point for tracking trends and for objectifying the identification effort required of operators, who may use it, transparently, alongside their own tools.
The detection gap: 89,000 players spotted by operators, 600,000 by the regulator
Operators carry a double legal obligation: identify excessive players and support them — calls, offers of moderators or tailored limits, referral to associations or care centres, or account closure.[1] Their effort has clearly increased: the number of excessive players they identify tripled between 2024 and 2025, from 31,000 to 89,000. The ANJ nevertheless judges this level inconsistent with the size of their player pools and with prevalence studies: its model counts about 600,000 on the same perimeter.
Our conclusion no. 2: the detection gap is measurable. In 2025, operators spotted about one probable excessive player in seven on the regulator's model — despite tripling their count in a year. The ANJ expects them, in the short term, to identify the roughly 300,000 manifestly excessive players, and to work at detecting the whole population flagged by the algorithm. At the 2027 review of the "Prevention of excessive or pathological gambling" action plans, it will be able to compare operators' declared numbers directly with its model's.[1]
Where the stakes concentrate: the confidential leagues
The October 2026 note analyses first-half 2026 football stakes through the four profiles. First gradient: the live-betting share falls as a competition's notoriety rises — 26% on the Champions League, 30 to 35% on the major leagues, 48% on secondary competitions, and up to 50 to 58% on European second divisions and unlisted championships.[3] These secondary competitions — defined as those each weighing less than 2% of the discipline's stakes — together represent 37% of football stakes, €2.3 billion spread over 93 competitions.
Second gradient, the cross with profiles: the more confidential the competition, the higher the share of stakes from excessive or manifestly excessive players. The best-known competitions are those where the recreational share is highest — about 35% on the 2026 World Cup, 50% including moderate-risk players. Conversely, excessive and manifestly excessive players carry more than 80% of stakes on the Brazil, Saudi Arabia, Japan and Australia championships.[3]
Period-of-play bets: 80 to 89% excessive stakes
The same exercise, applied to the types of result offered, leads to a neighbouring finding. On second-quarter 2026 stakes, bets on a competition's final result — the tournament winner, qualification for a final — are those where the recreational share is highest: 33% in football, 36% in tennis. At the opposite pole, bets on the result of a period of play (half, quarter, set, game), which lend themselves to live betting, are carried — depending on the sport — for 80 to 89% of their stakes by excessive or manifestly excessive players, and for only 5 to 11% by recreational players. In football, bets on the score or on player performances sit between the two (69 to 70% excessive stakes), against 57% for the match winner.[3]
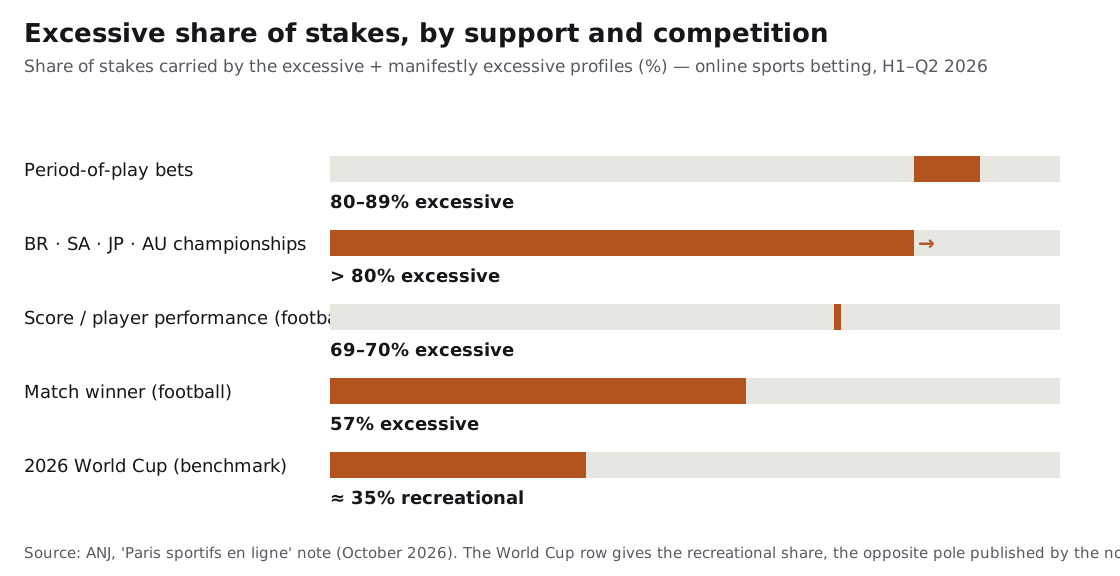
The ANJ draws an explicit regulatory lead from this finding: it could argue for better integrating player protection into the rules on authorised bet types.[3] Our conclusion no. 3: concentration follows obscurity and speed, not popularity — it is highest where betting is fast and played away from the spotlight (period bets, confidential leagues), and lowest where the occasional public gathers (final result, headline fixtures).
The full table: competition and bet type, profile by profile
The table below gathers every profile share the ANJ note publishes, support by support. Shares it does not publish are shown as such — never completed.
| Support | Recreational share | Recreational + moderate-risk share | Excessive + manifestly excessive share |
|---|---|---|---|
| 2026 World Cup (football, H1 2026) | ≈ 35% | 50% | n.p. |
| Brazil, Saudi Arabia, Japan and Australia championships (football, H1 2026) | n.p. | n.p. | > 80% |
| Final result of a competition — football (Q2 2026) | 33% | n.p. | n.p. |
| Final result of a competition — tennis (Q2 2026) | 36% | n.p. | n.p. |
| Score or player performances — football (Q2 2026) | n.p. | n.p. | 69–70% |
| Match winner — football (Q2 2026) | n.p. | n.p. | 57% |
| Result of a period of play — all sports (Q2 2026) | 5–11% | n.p. | 80–89% |
Reading note: "n.p." = share not published by the note for this support. The two published shares for a given support do not necessarily add up to 100%: the balance belongs to intermediate profiles or to shares the note does not detail. Source: ANJ, "Paris sportifs en ligne" note, October 2026.
Our analysis
What follows is our analysis, and it mixes three things that we distinguish at every step: the ANJ's findings, credited to it and cited; our calculations on its published tables, flagged as ours, with their margins; and our interpretations, labelled as such.
The ANJ publishes these shares support by support, and it does rank them within each family: by notoriety for competitions — the more confidential a competition, the higher the excessive players' share — and, for bet types, from the final result at one end to period-of-play bets at the other. What it does not do is read the two rankings together. Reading them together, we see a gradient that follows the speed of the product. At one end, bets on the result of a period of play (half, quarter, set or game) — the types that, in the note's own words, lend themselves to live betting — are carried for 80 to 89% of their stakes by excessive or manifestly excessive players, and the recreational share there collapses to 5–11%. Bets on the score or on player performances come next in the note's own ordering (69–70% excessive stakes), ahead of the match winner (57%). At the other end, slow markets keep a recreational core of about a third of stakes: ≈ 35% recreational share on the 2026 World Cup — 50% once moderate risk is included —, 33% on the final result of a competition in football and 36% in tennis.[3]
This gradient suggests a reading the note does not itself make: the shorter a market's feedback loop — bet, learn the outcome, bet again —, the more its stakes concentrate on excessive profiles. We present it as a reading of the published shares, not as a demonstrated property of the products: the ANJ itself attributes these gaps first to recreational bettors' lack of interest in the confidential supports, and the two mechanisms can coexist. Set against this page's other measurement, the gradient takes on its practical weight: of the ≈ 600,000 players the regulator's model flags in the second half of 2025, operators spotted only 89,000 — roughly one in seven.[1] And it is within sports betting — the perimeter of the shares above — that excessive profiles' stakes concentrate on the fastest products. Our reading, labelled as such: the gap between the players the model sees and the players operators identify weighs heaviest where that concentration is strongest, on the markets that lend themselves to live play and settle fastest — the two measurements not covering the same perimeter, the shares being measured on football stakes and the flagged population across all account-based play.
An always-on offer: €900 million staked outside European slots
The note's third finding: the geographic arrangement of the competitions open to betting composes a live football offer available continuously. South American championships cover the night (52 to 67% live betting), Asian and Oceanian championships the morning (58 to 64%) — for a total of about €900 million of annual stakes outside European slots, or 14.2% of football stakes.[3] At comparable notoriety, competitions played outside European slots also show a live share 11 to 18 points higher than European secondary competitions.
This frame reads against the 2025 market the note describes elsewhere: €11.5 billion of online sports-betting stakes (+12.0%) and €1,766 million of gross gaming revenue (+10.4%), football taking 54.9% of stakes and tennis 23.0%; the return-to-player rate stood at 84.67%, under an annual cap of 85%.[2] Our conclusion no. 4: the offer's continuity is geographic before it is hourly — 14.2% of football stakes are placed outside European slots because the authorised offer covers, by construction, other continents' night and morning.
The European context: smaller, more frequent stakes (EGBA)
Context block, on a distinct perimeter: the EGBA (European Gaming and Betting Association) publishes the aggregated data of its nine member operators, at European scale — a different perimeter from the ANJ's, which we merge with no French figure. In 2025, these members recorded 248.7 billion stakes (+40%), for a total value of €275.3 billion (+28%); the average stake fell 9%, from €1.21 to €1.11, and active customer accounts reached 43.8 million (+13%).[4]
The EGBA's own reading of this falling average stake — a shift towards higher-frequency, lower-value betting — echoes, without merging into, the French gradient: on both sides, activity is moving towards faster, more repeated formats. In France, the regulator measures who carries these formats; at the scale of the EGBA's members, the association measures their spread. The two measures do not overlap and do not add up.
What these figures do not measure (online casino and crash games outside the perimeter)
Every ANJ figure on this page describes licensed account-based gambling in France: licensed online operators, FDJ and PMU. Online casino is not licensed in France; it therefore escapes the algorithm entirely — and with it crash games, which belong to that category. None of the concentration rates published here (8.7%, 60%, 80–89%) describes an online-casino or crash-game player, and we convert none of these figures into an estimate for that perimeter: the measurement stops where the perimeter stops.
Our conclusion no. 5: what is measured is a perimeter floor, not a national total. What the algorithm cannot see is covered by another of our dossiers — the size reconciliation of France's illegal gambling market — while the portrait of crash-game players, measured by other methods, is published in our crash game player statistics. All our series are gathered in the crash games statistics 2026 hub. If your own play concerns you, our responsible gambling page gathers the available moderators and support.
Full dataset: the table of this page's figures (algorithm, concentration by support, EGBA context), in CSV format — the exact values from which every figure published here is drawn, with unpublished shares left empty. Download the CSV
Free reuse for press and research, with attribution: "Source: ANJ (2026) — figures compiled by Chicken Road Productions" — https://chickenroadproductions.com/en/excessive-gambling-statistics-france/
Quoting these figures? The newsroom answers via the Press page.
Methodology and limits
How to read this page: this is an independent analysis, published for information. It recommends neither the purchase, use nor avoidance of any product, and is not financial advice. Every figure is calculated from the data published with this study or from the operator's published terms. We are funded by affiliate commissions disclosed on this site; no operator reviewed or approved this analysis before publication.
References
- ANJ, "L'algorithme développé par l'ANJ révèle un nombre de joueurs excessifs inquiétant et en croissance", 13 May 2026, https://anj.fr/lalgorithme-developpe-par-lanj-revele-un-nombre-de-joueurs-excessifs-inquietant-et-en-croissance
- ANJ, "Paris sportifs en ligne : quels sont les sports ou les compétitions moteurs de la croissance ?", October 2026, https://www.anj.fr/paris-sportifs-en-ligne-quels-sont-les-sports-ou-les-competitions-moteurs-de-la-croissance
- ANJ, "Note sports 2025" — full note (PDF), October 2026, https://www.anj.fr/sites/default/files/2026-10/Note%20sports%202025.pdf
- EGBA, "Annual Activity Report 2026", 9 July 2026 — market data of the nine member operators (Market Data section), https://www.egba.eu/news-media/press-releases/
Our other statistics
The world crash-game market: crash games statistics 2026 — 1 million simulated rounds.
The player portrait: who plays crash games — profile and behavior in figures.
The ground: crash games in Morocco and Africa — market, mobile and offshore in figures.
The neighbouring ground, country by country: online betting in Africa by country — the GeoPoll 2026 survey (2,866 bettors, six countries).