
Crash game statistics: what 1,000,000 simulated rounds reveal
For press and research
Covering crash games? Here are 1,000,000 simulated rounds and their numbers: statistics you can quote as they stand, the complete dataset free to download, and an open methodology published in full, so every figure can be reproduced and verified by anyone.
- A myth, measured: even with perfect discipline, 56% of 100-round sessions end losing.
- A scam dismantled by maths: rounds are independent — no “predictor” has a pattern to read.
- A complete dataset to explore: 1,000,000 rounds in an open CSV, bust curve included.
- The invisible gap, finally quantified: 98% theoretical RTP, 97.6% realized at a fixed 2.00x cashout.
The complete dataset is attached to this page, free to download.
The headline: 1 million rounds in 5 numbers
Where these numbers come from — and what you can do with them: they come from a simulation we generated and published in full, 1,000,000 rounds drawn from the documented crash-game distribution model, at the 98% RTP InOut Games publishes for Chicken Road. The attribution line comes with the data, the complete file — one row per round — is downloadable at the end of this page, and the detailed methodology (formula, parameters, seed) is published under “Sources and methodology”, below, so every figure can be reproduced. These are not rounds measured at an operator: they are the model’s own arithmetic, checkable by anyone who downloads the data.
What do 1,000,000 simulated rounds actually say?
First, that the typical round is short. Half of all rounds bust before 1.95x, and the most crowded territory sits between 1.50x and 3.00x — 32.7% of rounds. Big multipliers exist, but they are rare by construction: 9.80% of rounds reach 10.00x, 0.98% reach 100.00x, and the largest bust in the million exceeds 3.1 million — an event that tells you nothing about your next round, except that the tail of this distribution is very long.
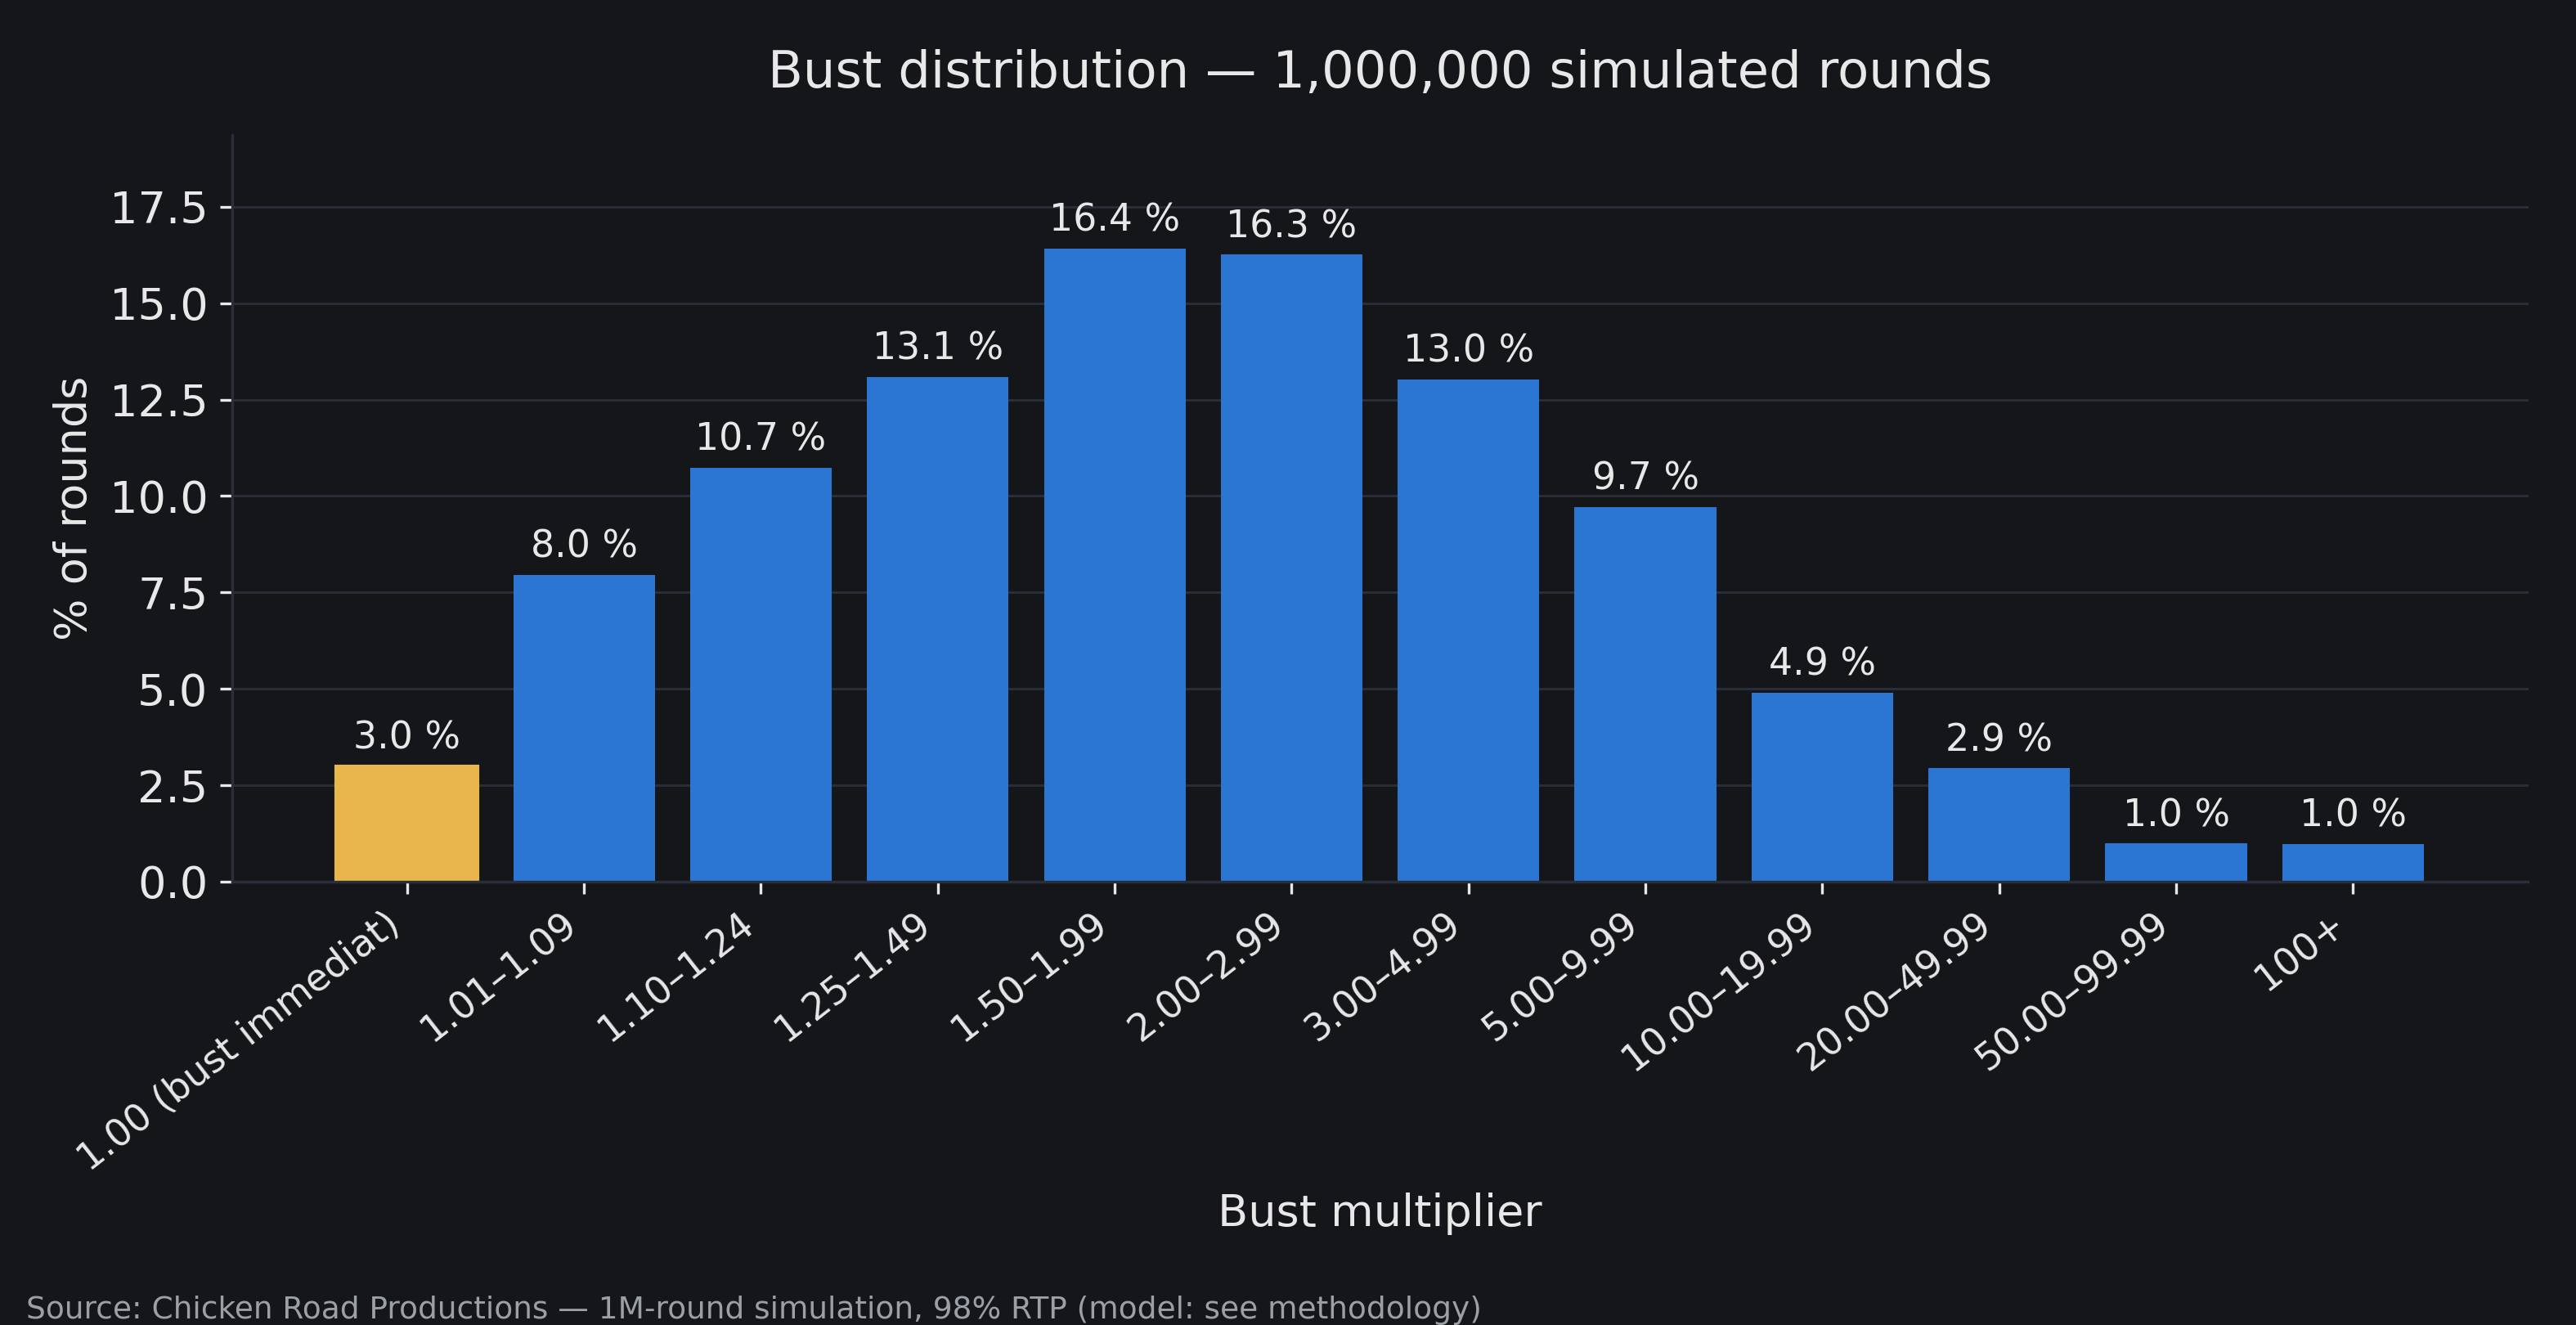
| Bust (multiplier) | Rounds | Share |
|---|---|---|
| 1.00 (immediate bust) | 29,982 | 3.00% |
| 1.01 – 1.09 | 79,602 | 7.96% |
| 1.10 – 1.24 | 107,401 | 10.74% |
| 1.25 – 1.49 | 130,869 | 13.09% |
| 1.50 – 1.99 | 164,123 | 16.41% |
| 2.00 – 2.99 | 162,564 | 16.26% |
| 3.00 – 4.99 | 130,306 | 13.03% |
| 5.00 – 9.99 | 97,109 | 9.71% |
| 10.00 – 19.99 | 48,995 | 4.90% |
| 20.00 – 49.99 | 29,410 | 2.94% |
| 50.00 – 99.99 | 9,893 | 0.99% |
| 100.00 and above | 9,746 | 0.98% |
Read this way: the average bust is nearly meaningless (9.93x, even after capping at 10,000x) — a handful of extreme rounds drags it upward. The median (1.95x) and the full distribution are the honest summaries.
Where do most rounds stop?
Early. The median bust is 1.95x, so one round in two never reaches 2.00x. Read from the cashout side, the same reality becomes a survival curve: 89.04% of rounds reach 1.10x, 65.22% reach 1.50x, 48.80% reach 2.00x — a 2.00x target wins slightly less than half the time — 9.80% reach 10.00x and 0.98% reach 100.00x.
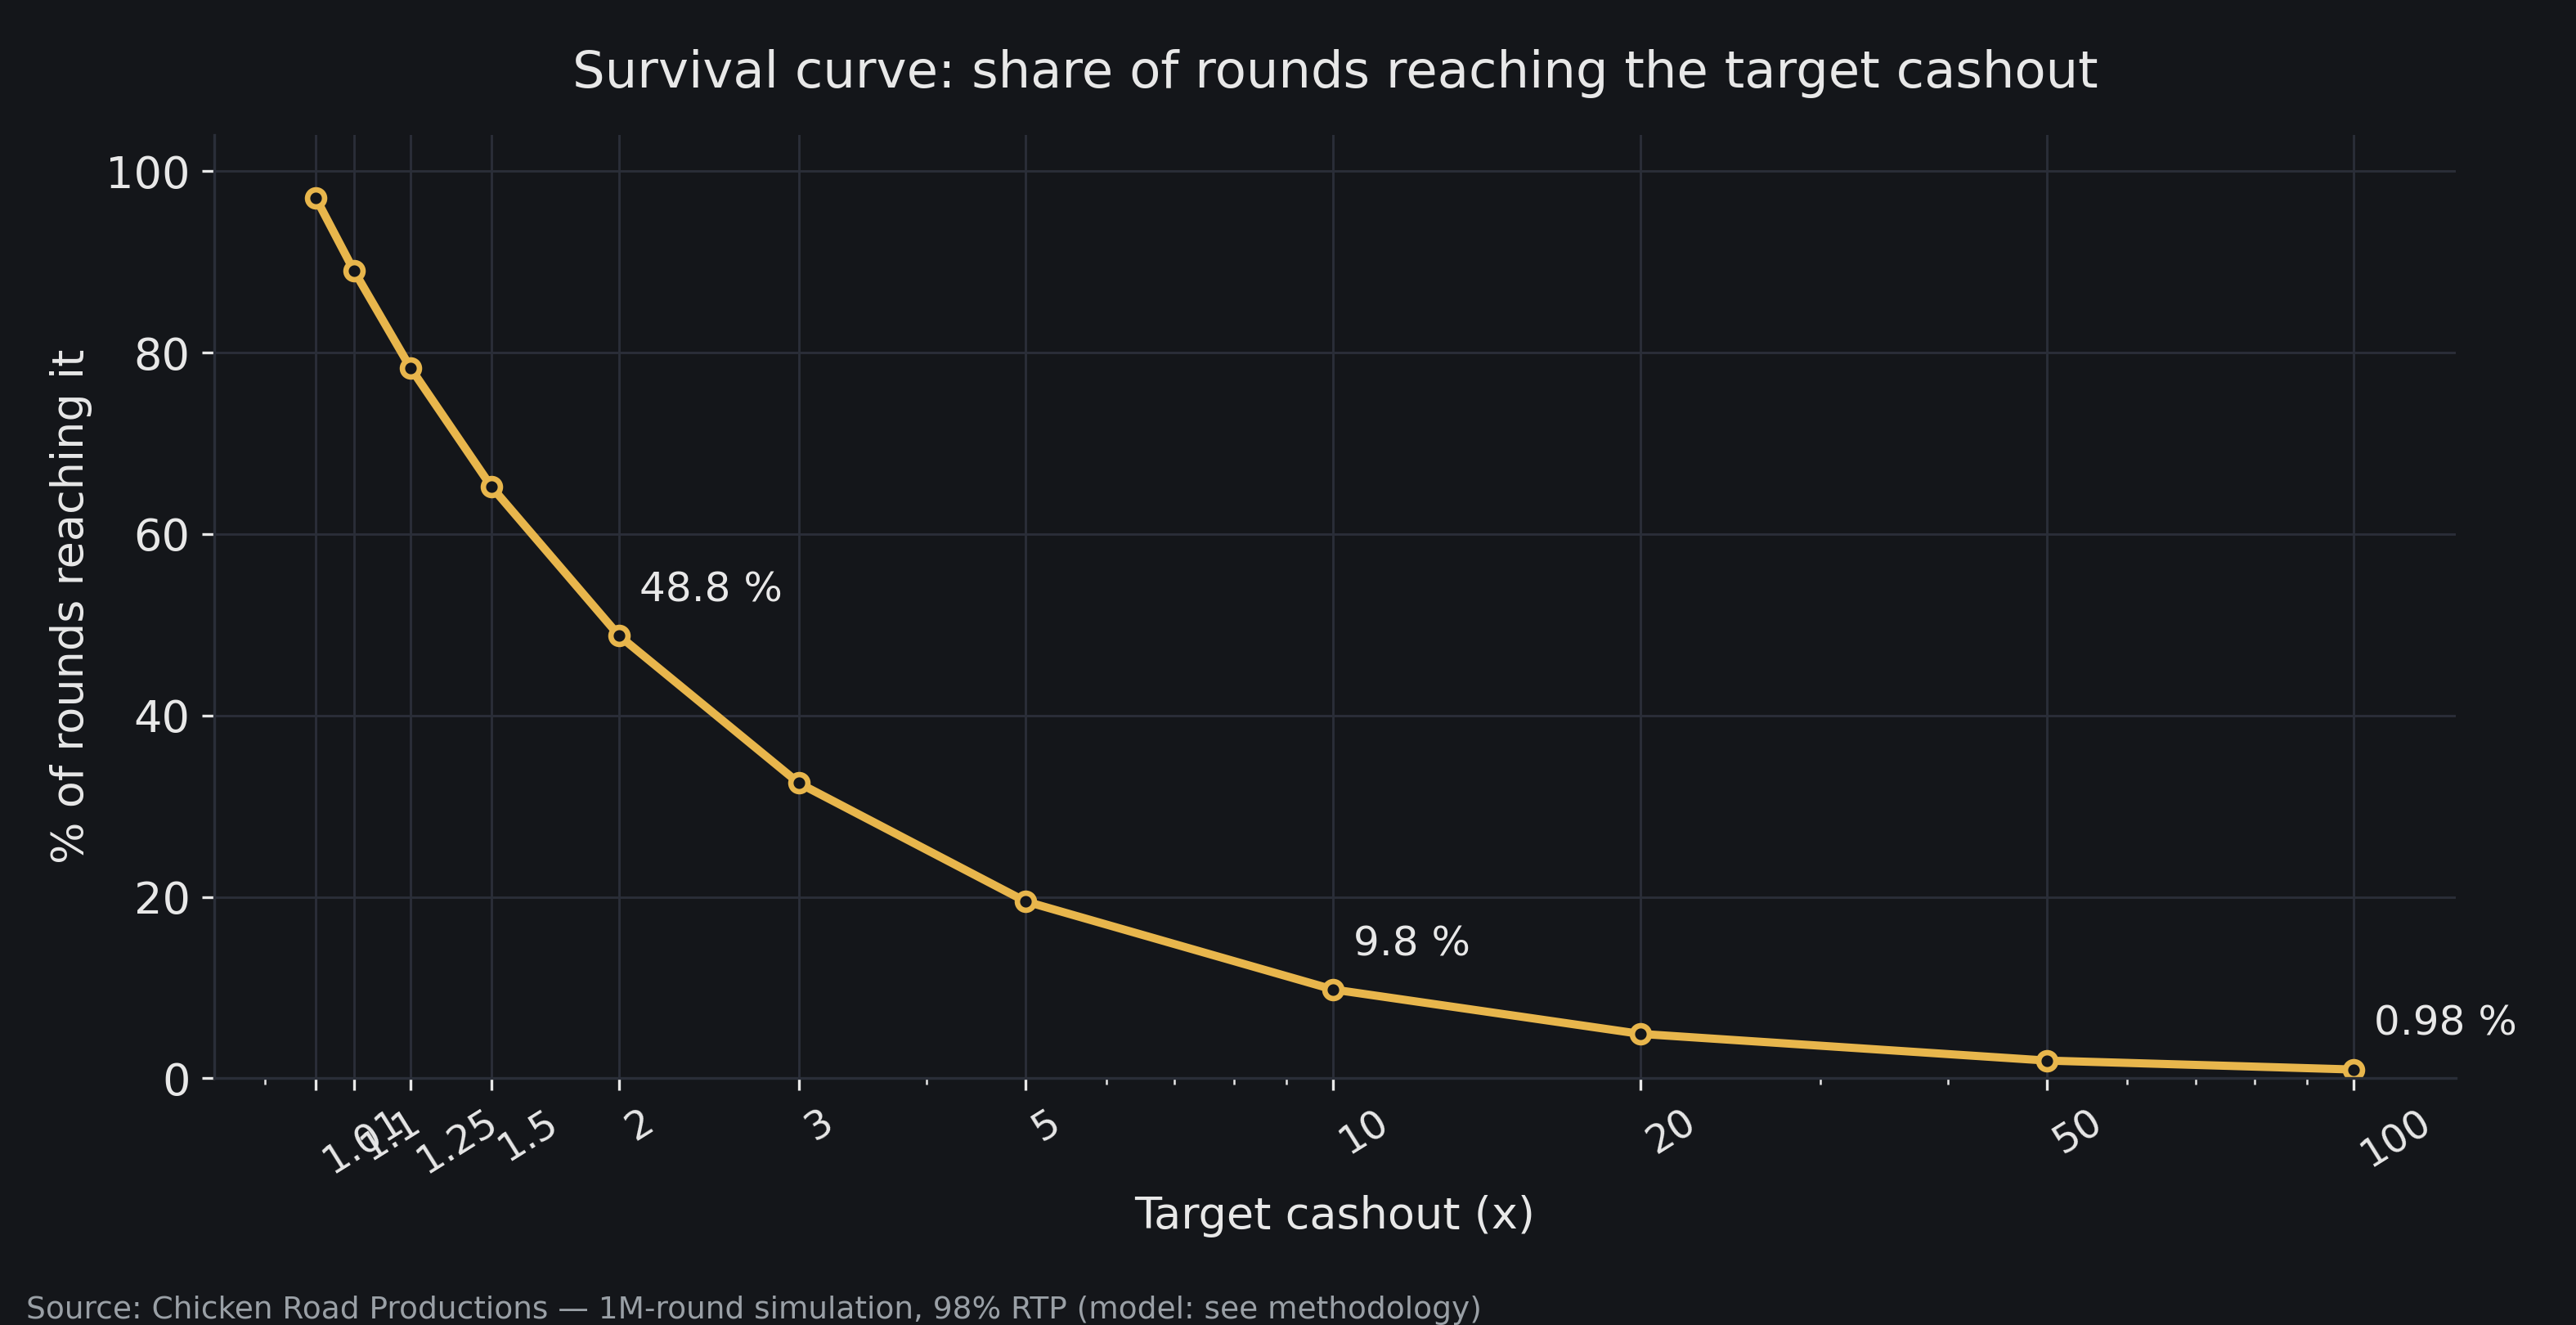
That regularity is no simulation accident: it is the shape of the crash distribution itself, derived in the UNLV study we summarize elsewhere — roughly 1 round in 2 reaches ×2, 1 in 10 reaches ×10, 1 in 100 reaches ×100. Our reading of the "Cash or Crash" study walks through the derivation, and our comparator applies the same survival logic step by step.
Theoretical RTP vs lived RTP: how wide is the gap?
Across 1 million rounds, the gap is tiny: realized RTP hugs the theoretical 98% at every cashout target — 97.95% at 1.10x, 97.60% at 2.00x, 98.04% at 10.00x; across the eleven targets tested, the spread runs from 97.46% to 98.19%, which is sampling noise around 98%. No target "beats" the model: changing the target changes the shape of your results, never their average.
At session scale, the story flips. Slicing the million rounds into 10,000 sessions of 100 rounds (flat stake, fixed 2.00x cashout), 56.0% of sessions end losing, 36.3% end ahead and 7.7% break even. The median session loses 2 units per 100 staked; 10% of sessions lose 16 units or more, while 10% gain 10 or more. The 98% figure is true — but it describes the million, not your hundred rounds.
Cashing out early does not close that gap; it moves it. At 1.10x, 66.9% of 100-round sessions still end losing — smaller, more frequent losses (median session: −2.1 units; 10% of sessions at −6.5 or worse). This is exactly what our RTP simulator shows: variance runs the session, RTP only governs the very long run.
What the curves say — and why
Two independent measures tell the same story. In Google search interest (index 0–100, five games compared in a single query to keep the scale honest), Aviator dominates the entire 2023–2026 period, peaking at 100 around August 2025 [1]. In absolute players, it rose from 10 to 77 million monthly [2]. When two different indicators converge, the conclusion strengthens: the gap is not a measurement artefact.
The second chart deserves its own comment: the absolute-player curve looks nothing like the spikes in the first. From 10 million in early 2023 to 77 million in mid-2026 [2], the progression is monotone — 10 → 42 → 50 → 60 → 70 → 72 → 77 — with the biggest step as early as 2023–2024, then steady growth. No peak, no collapse: this is the signature of structural adoption, not buzz. And it is exactly what distinguishes Aviator in the first chart: where Spaceman and Chicken Road draw events, Aviator draws a baseline.
Why Aviator? First-mover advantage first: launched in 2019 [3], it popularised the crash format for the mainstream online-casino public — the format had existed since 2014 [4], but confined to crypto sites. Distribution second: thousands of operators, 60+ countries, and multi-year UFC and WWE deals signed in January 2025 [5] that extended its visibility. The advantage is that of an incumbent — network and recognition — more than that of an innovator.
Spaceman's early-March 2024 spike (~91) deserves an honest reading: it coincides to the day with the Netflix release of the film "Spaceman" starring Adam Sandler (1 March 2024) [6]. The index very likely measured the film, not the game — the perfect illustration of the generic-term limit, and the reason we flag it. And the fall that follows confirms the diagnosis: 91 → 10 in six weeks is the signature of a media event, not adoption. A release buzz fades with the news cycle; had the game itself gained players, the curve would have formed a plateau, not a V.
Chicken Road is the only challenger whose curve takes off, from mid-2025 (peak ~27) [1]. But a spike in interest is not a spike in players. Why did the peak subside (27 → ~6–10)? First, viral attention is reversible by nature: attention cycles are short. Second, TikTok's moderation was already running at full tilt across every category: in Q2 2025 the platform removed more than 189 million videos in total [7] — 0.7% of everything uploaded that quarter — and it then adopted its unified policy on regulated goods (gambling, alcohol, tobacco, drugs, firearms), announced on 14 August 2025 and effective 13 September 2025 [8]. A tightened moderation climate that may have throttled the attention loop carrying the game, though the data do not prove direct causation. Finally, without an Aviator-scale distribution network, nothing converts the peak into a lasting plateau. The new baseline (~6–10) remains above the pre-viral ~0–3: the wave left a trace, not an empire. Both curve shapes were verified against the real weekly Google Trends data (single query, 5 terms, 197 weeks).
JetX, finally, stays near zero across the period. A cautious reading: without a breakout moment or Aviator-scale distribution, a crash game does not take off in search. That is not a verdict on its quality.
"Even the most disciplined player loses more than one session in two over 100 rounds: the 98% RTP is an average computed over the very long term, not a promise at the scale of a single session. The distribution decides the session — the player only chooses the shape of their variance."
— The Chicken Road Productions editorial team
Available for an interview or a comment on this data: contact the editors via the Press page.
Sources and methodology
References
- Google Trends, trends.google.com — single query "Aviator, JetX, Spaceman, Chicken Road, Chicken Road 2", worldwide, 01/01/2023 → 04/10/2026, 197 weeks.
- Spribe — 10M monthly players May 2023, InterGame 31/05/2023, https://www.intergameonline.com/land-based-gaming/spribes-aviator-crash-game-goes-to-panama ; 77M+ June 2026, iGaming Business via OnlineCasinoRank 24/07/2026, https://markets.financialcontent.com/ibtimes/article/marketersmedia-2026-7-24-onlinecasinorank-releases-the-2026-mid-year-casino-games-report-ranked-by-real-player-data ; 2,000+ operators, European Gaming 20/10/2023, https://europeangaming.eu/portal/latest-news/2023/10/20/145525/spribe-to-activate-this-week-at-highly-anticipated-ufc-294-in-abu-dhabi/.
- Aviator 2019 launch — European Gaming 10/09/2026, https://europeangaming.eu/portal/press-releases/2026/09/10/213862/spribe-aviator-studio-malta-injunction/.
- Crash-format origins MoneyPot 2014, BustaBit 2015 — The Zimbabwean 28/08/2026, https://www.thezimbabwean.co/2026/08/the-history-of-crash-games-in-online-casino-gaming/.
- UFC/WWE multi-year deals, 60+ countries — PR Newswire via Nasdaq 23/01/2025, https://www.nasdaq.com/press-release/spribe-inks-multiyear-partnership-deals-ufc-and-wwe-amplify-global-reach-aviator-2025.
- "Spaceman" film, Netflix 01/03/2024, https://en.wikipedia.org/wiki/Spaceman_(2024_film)).
- TikTok CGER Q2 2025, https://hapakenya.com/2025/11/04/tiktok-q2-2025-report-details-massive-global-content-enforcement/.
- TikTok Community Guidelines overhaul — unified policy on regulated goods, WebProNews, September 2025, https://www.webpronews.com/tiktok-overhauls-guidelines-ai-labels-misinfo-bans-start-sept-2025/
Full dataset: 1,000,000 rows (one per round: round number, bust multiplier), in CSV format — the same file every figure on this page is drawn from. Download the CSV (12 MB)
Free to reuse in press and research, with attribution: "Source: Chicken Road Productions, 1M-round simulation, 2026" — https://chickenroadproductions.com/en/crash-games-statistics-2026/
Our other statistics
The player portrait: who plays crash games — profile and behavior in figures.
The cost of a tactic: the real cost of low cashout — what cashing out at 1.01x–1.10x actually costs.
The streak myth: after a run of busts, is the big multiplier 'due'?
Frequently asked questions
Does this data come from real games played?
No. These are 1,000,000 rounds simulated from the documented crash-game distribution model (the law P(bust ≥ x) = RTP / x, at 98% RTP), not rounds measured at an operator. The full methodology — formula, parameters, seed — is published on this page and the complete CSV is downloadable: anyone can verify or reproduce every figure.
Why is the median bust so low (1.95x)?
Because the distribution piles its mass onto small multipliers: the probability of a round going far falls off as 1/x. In concrete terms, 51.2% of rounds stop before 2.00x and 90.2% before 10.00x. Large multipliers exist (0.98% of rounds pass 100.00x), but they are paid for by their rarity, not by a different expectation.
Is cashing out at 1.10x a "safe" strategy?
No. 10.96% of rounds bust before 1.10x — each one costs the whole stake, against a gain of 0.10 per winning round. Across 100-round sessions at 1.10x, 66.9% end losing. The realized RTP at that target is 97.95%, the same as everywhere else: no target changes the expectation.
Does 98% RTP guarantee I get 98% of my stakes back?
No. 98% is an average computed over millions of rounds. Over 100 rounds at 2.00x, our simulated sessions range from −16 units or worse (10% of cases) to +10 or better (10% of cases), with 56.0% of sessions losing. The shorter the session, the wider the possible gap from the average.
Can I cite or reuse these figures?
Yes, freely, with the attribution "Source: Chicken Road Productions, 1M-round simulation, 2026" and a link to this page. The complete CSV is downloadable in the section above; for a specific extract or format, the editors reply via the Press page.